Financial and Revenue Intelligence Toolkit
By Zuar, Inc.Analytics
- Rating
- Not rated yet
- Reviews
- No reviews yet
- Pricing
- Free
- Listed since
- 2023
About Financial and Revenue Intelligence Toolkit
Understand your business performance with this finance & revenue toolkit.
Zuar built this toolkit from their experience with CPG and Retail customers. Connect with them to learn more about their industry-specific services.
- - Required Data Attributes --
Strategic Forecast Summary: Order detail, detail for the last 12 months + Opportunity detail for the next 12 months
- Date (date)
- Customer (string)
- Account Manager (string)
- Channel (string)
- Region (string)
- Order ID (string)
- Record Type (Order or Opportunity) (string)
- Days Since Last Order (int)
- Sales Total (from Orders) (currency)
- Sales Forecasted (from Opportunities) (currency)
YTD Growth Watch: Order detail, starting from the beginning of the prior year.
- Date (date)
- Customer (string)
- Channel (string)
- Account Manager (string)
- Region (string)
- Product Line (string)
- Product Name (string)
- Sales Total (Dollars)
Inventory Planning
- Product Line (string)
- Product Name (string)
- Product ID (string)
- Quantity on Hand (int)
- Price (currency)
- Stock Par Max (Units) (int)
- Stock Par Min (Units) (int)
- Date (date)
- Item Quantity Forecasted (Units) (int)
- Replenish Quantity Expected (Units) (int)
Highlights
- YTD Growth Watch: where deep details about growth across key sectors of your business enable you to optimize how your organization operates.
- Answer Key Business Questions ✅ What is YTD revenue now, plus YOY and MoM? ✅ What is current and forecasted revenue across business sectors? ✅ What customers are driving growth and which are at risk?
- Answer MORE Key Business Questions! ✅ How the sales and orders from each customer are expected to change? ✅ What are the inventory stock levels, plus future projections? ✅ How much revenue is at risk from depleted stock levels?
- Strategic Growth Forecast: where you can see the relationship between orders and revenue growth, and provide more accurate and data-driven sales forecasts to your leadership.
- Monitor and Improve KPIs ✅ Revenue YTD ($) ✅ Change in Revenue Over Prior Period (%) ✅ Change in Sales ($ and %) ✅ Change in Orders (PO Count and %) ✅ Change in Average Order Size ($/PO and %) ✅ Change in Order Frequency (Days Between Orders)
- Monitor and Improve MORE KPIs! ✅ Current Inventory in Units ✅ Replenishment Rate in Units/Month ✅ Sales Forecast in Units/Month ✅ Revenue at Risk Due to Stock Shortages ✅ Projected Ending Supply and Balance Over Time ✅ Months of Stock at Current ROS
- Inventory Supply Planner: where you can make sure that inventory stock levels will enable your revenue goals.
Screenshots
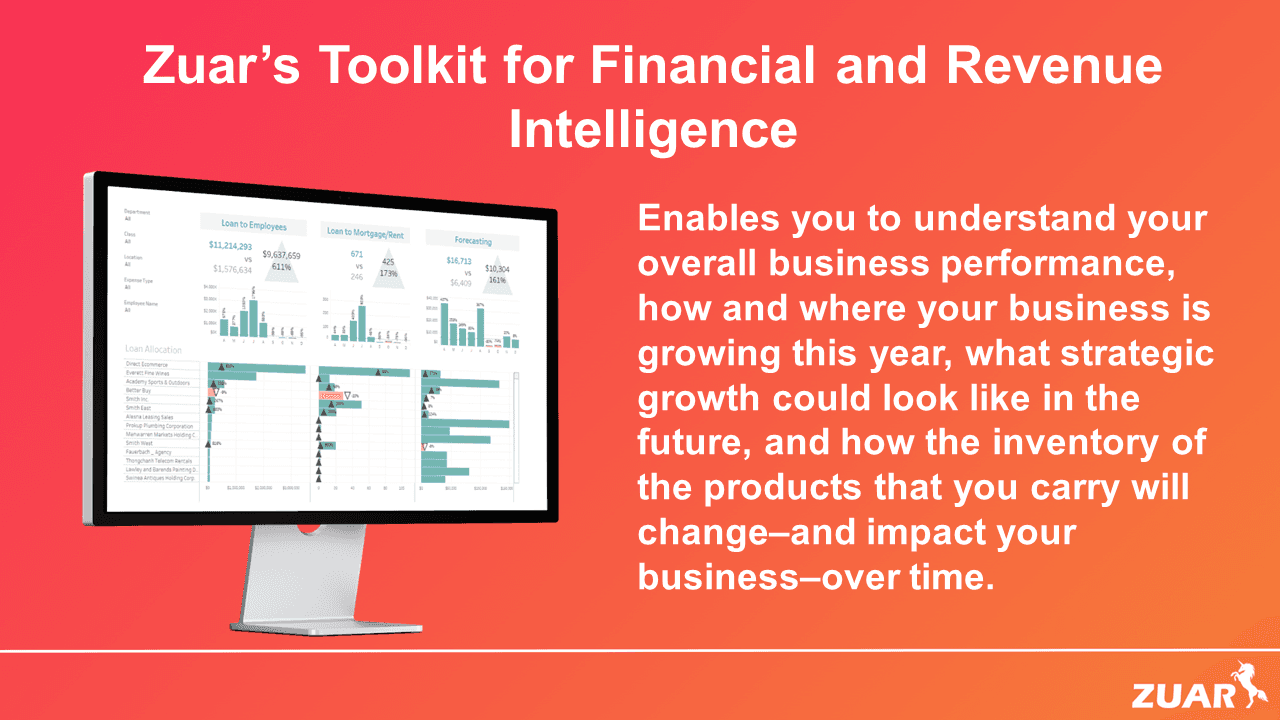
Image 1 of 4
Pricing
Free.
Compatibility
- Works with
- Tableau
- Tableau Server
- Tableau Cloud
- Requires
- Tableau
- Industries
- Horizontal Product
- Financial Services
- Languages
- English
More Analytics apps
The most reviewed Analytics apps on the AppExchange, to compare before you choose.