Bump Chart Dashboard Extension
By Salesforce Labs
- Rating
- Not rated yet
- Reviews
- No reviews yet
- Pricing
- Free
- Listed since
- 2026
About Bump Chart Dashboard Extension
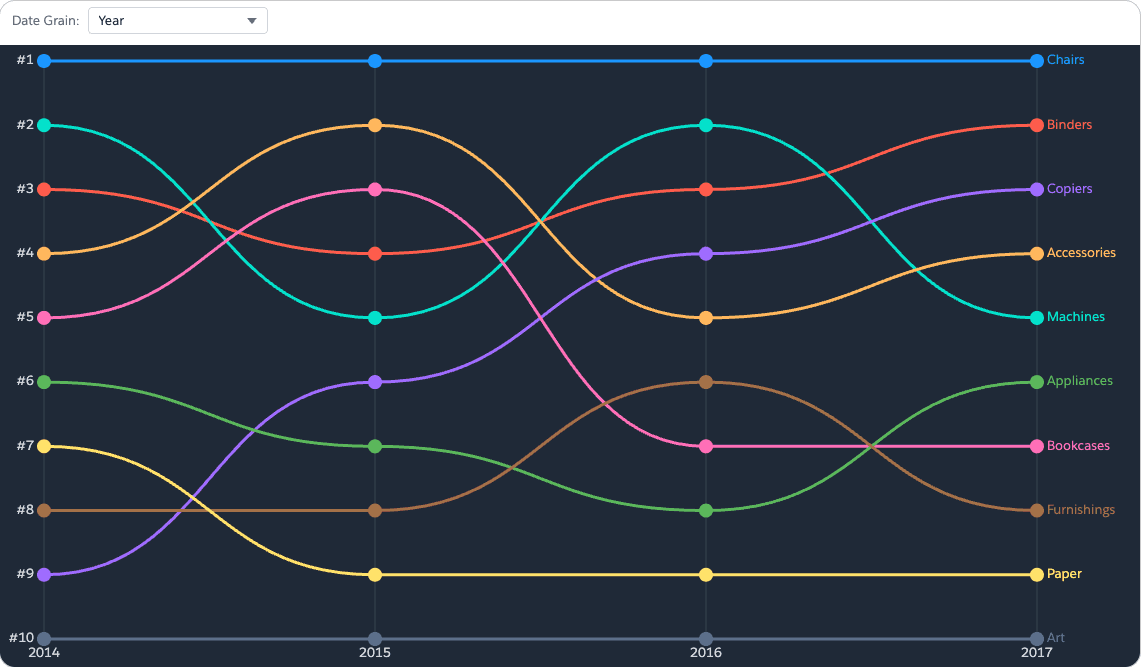
Visualize competitive rank shifts trends in your dashboard
Transform your dashboard insights with the Bump Chart Dashboard Extension. Designed for seamless integration into your Tableau Next environment, this extension allows you to track the movement of key metrics—such as sales, profits across different dimensions and over time, making it easy to identify crossover points and leadership shifts at a glance.
Built for flexibility, this extension allows you to query any semantic model, plot any measures, and dimensions directly within the authoring experience. Whether you need to monitor performance month-over-month or track year-to-date dominance, the Bump Chart provides a zero-code way to turn complex trend data into actionable insights.
Highlights
- Dynamic Rank Visualization: Instantly visualize how entities move up or down in rank, helping you pinpoint performance trends and crossovers across your business metrics.
- Flexible Configuration: Easily select your semantic models, measures, and drill-down dimensions to create custom views tailored to your specific reporting needs.
Screenshots
Pricing
Free.
Compatibility
- Works with
- Tableau Next
- Requires
- CDP
- Salesforce editions
- Enterprise
- Unlimited
- Performance
- Developer
- Lightning Experience
- Supported
- Salesforce mobile app
- Not supported
- Salesforce security review
- Passed on August 17, 2026
- Industries
- Horizontal Product
- Languages
- English